Note
Go to the end to download the full example code
Intensity image
import pylab as plt
import tttrlib

ht3_filename_img = '../../tttr-data/imaging/pq/ht3/crn_clv_img.ht3'
data = tttrlib.TTTR(ht3_filename_img, 'HT3')

clsm = tttrlib.CLSMImage(tttr_data=data, fill=True, channels=[0])
CLSM images usually consist of a set of frames.
intensity = clsm.intensity
print(intensity.shape)
plt.imshow(clsm.intensity.sum(axis=0))
plt.show()
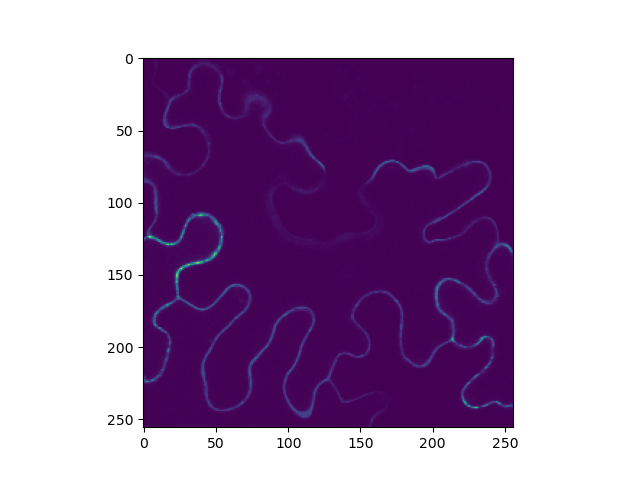
(40, 256, 256)
Filled CLSMImages can be stacked. Stacking assigns the photons of pixels in frames to the first frame. Note, stacking simply combines the tttr indices in a pixels. After stacking the CLSMImage should not be “refilled” as this can result in undefined behavior.
clsm.stack_frames()
clsm_stacked_int = clsm.intensity
Total running time of the script: (0 minutes 5.319 seconds)