Note
Go to the end to download the full example code
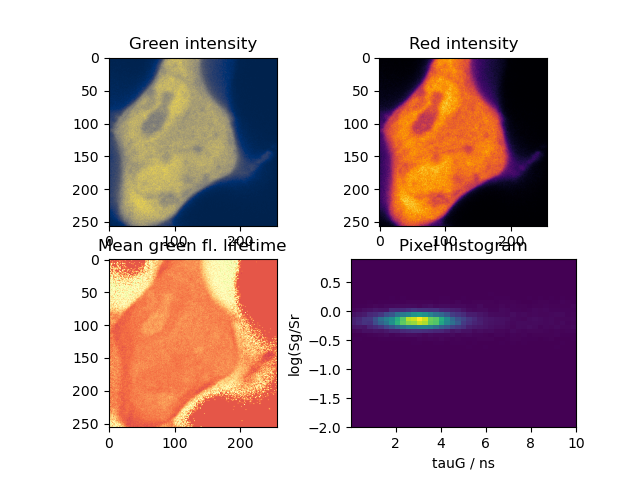
Mean lifetime images
Compute the mean lifetime in a pixel using the method of moments (Irvin Isenberg, 1973, Biophysical journal).
import tttrlib
import numpy as np
import pylab as plt

filename = '../../tttr-data/imaging/zeiss/eGFP_bad_background/eGFP_bad_background.ptu'
filename_irf = '../../tttr-data/imaging/zeiss/eGFP_bad_background/IRF.ptu'

data = tttrlib.TTTR(filename)
irf = tttrlib.TTTR(filename_irf)

channels_green = [0, 2]
channels_red = [1, 3]

# Assume constant background (same shape as IRF)
data_irf = irf[irf.get_selection_by_channel(channels_red)]
plt.xlim(0, 5000)
irf_np, x = data_irf.get_microtime_histogram(1)
background = np.ones_like(irf_np)
plt.semilogy(background)
[<matplotlib.lines.Line2D object at 0x7f2a0730c640>]
Create a new CLSM Image. This image will be used as a template for the green and red image. This avoids passing through the TTTR screen multiple times. The frame line, and pixel locations will be copied for the green and red image from this template.
clsm_template = tttrlib.CLSMImage(data)
clsm_green = tttrlib.CLSMImage(
    source=clsm_template,
    channels=channels_green
)
clsm_red = tttrlib.CLSMImage(
    source=clsm_template,
    channels=channels_red
)

mean_tau_green = clsm_green.get_mean_lifetime(
    tttr_irf=irf[irf.get_selection_by_channel(channels_green)],
    tttr_data=data,
    minimum_number_of_photons=5,
    background=background,
    background_fraction=0.02,
    stack_frames=True
)

green = clsm_green.intensity.sum(axis=0)
red = clsm_red.intensity.sum(axis=0)

mask = (green < 20) + (red < 20)
masked_green = np.ma.masked_where(mask, green)
masked_red = np.ma.masked_where(mask, red)
masked_tau = np.ma.masked_where(mask, mean_tau_green.mean(axis=0))
lg_sg_sr = np.log(masked_green / masked_red)

fig, ax = plt.subplots(nrows=2, ncols=2)
ax[0, 0].set_title('Green intensity')
ax[0, 1].set_title('Red intensity')
ax[1, 0].set_title('Mean green fl. lifetime')
ax[1, 1].set_title('Pixel histogram')
ax[1, 1].set_xlabel('tauG / ns')
ax[1, 1].set_ylabel('log(Sg/Sr')
ax[0, 0].imshow(green, cmap='cividis')
ax[0, 1].imshow(red, cmap='inferno')
ax[1, 0].imshow(mean_tau_green.mean(axis=0), cmap='Spectral')
ax[1, 1].hist2d(
    x=masked_tau.flatten(),
    y=lg_sg_sr.flatten(),
    range=((0.001, 10), (-2, 0.9)),
    bins=41
)
plt.show()
/builds/skf/tttrlib/examples/flim/plot_lifetime_moments_bg.py:58: RuntimeWarning: divide by zero encountered in log
  lg_sg_sr = np.log(masked_green / masked_red)
Total running time of the script: (0 minutes 4.137 seconds)