Note
Go to the end to download the full example code
Fluorescence decay analysis - 3
import pylab as p
import scipy.optimize
import scipy.stats
import numpy as np
import tttrlib
def objective_function(
x: np.ndarray,
x_min: int,
x_max: int,
irf: np.array,
max_irf_fraction: float = 0.05
):
max_irf = np.max(irf) * max_irf_fraction
w = np.copy(irf[x_min:x_max])
w[w < 1] = 1
w[np.where(irf > max_irf)[0]] = 1
chi2 = (((irf[x_min:x_max] - x[0])/w)**2).sum(axis=0)
return chi2
# Read TTTR
spc132_filename = '../../tttr-data/bh/bh_spc132_sm_dna/m000.spc'
data = tttrlib.TTTR(spc132_filename, 'SPC-130')
data_green = data[data.get_selection_by_channel([0, 8])]
# the macro time clock in ms
macro_time_resolution = data.header.macro_time_resolution
# Make histograms
n_bins = 512 # number of bins in histogram
x_min, x_max = 1, 512 # fit range
dt = data.header.micro_time_resolution * 4096 / n_bins # time resolution
time_axis = np.arange(0, n_bins) * dt
# IRF
# select background / scatter, maximum 7 photons in 6 ms
time_window_irf = 6.e-3
n_ph_max_irf = 7
irf, _ = np.histogram(
data_green[
data_green.get_selection_by_count_rate(
time_window=time_window_irf,
n_ph_max=n_ph_max_irf
)
].micro_times, bins=n_bins
)
x0 = np.array([4])
fit = scipy.optimize.minimize(
objective_function, x0,
args=(x_min, x_max, irf),
method='BFGS'
)
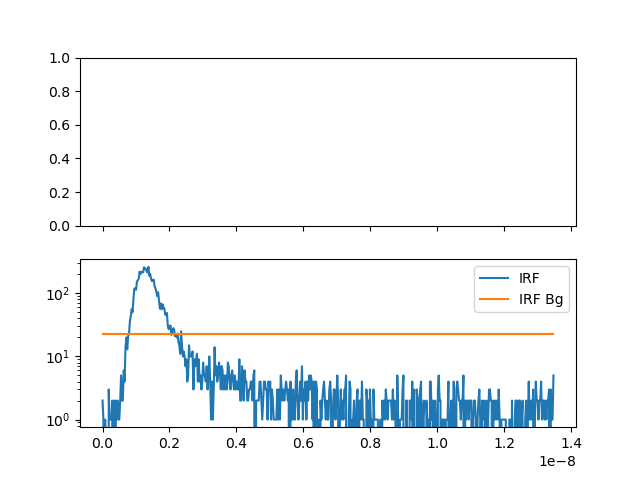
irf_bg = fit.x
fig, ax = p.subplots(nrows=2, ncols=1, sharex=True, sharey=False)
ax[1].semilogy(time_axis, irf, label="IRF")
ax[1].semilogy(
time_axis[x_min:x_max],
np.ones_like(time_axis)[x_min:x_max] * irf_bg, label="IRF Bg"
)
ax[1].legend()
p.show()
Total running time of the script: (0 minutes 0.917 seconds)