Note
Go to the end to download the full example code
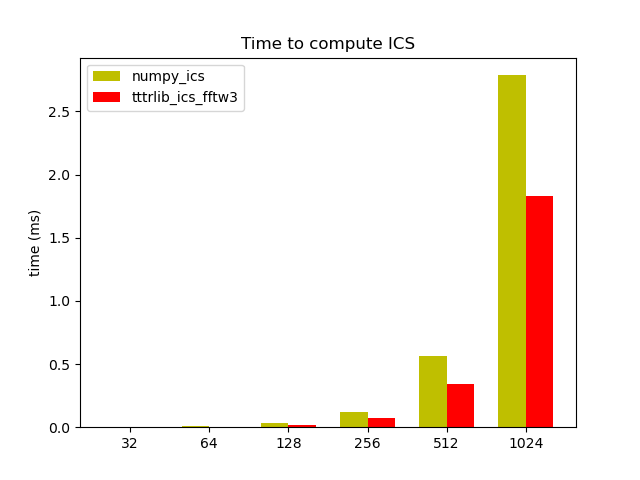
Image correlation spectroscopy - benchmark
import tttrlib
import numpy as np
import scipy.stats
import pylab as p
import timeit


def numpy_fft_ics(
        images: np.ndarray,
        subtract_average
):
    if subtract_average:
        images = images - images.mean(axis=0) + images.mean()
    ics_list = list()
    _, nx, ny = images.shape
    N = nx * ny
    for im in images:
        img_flucc = im - im.mean()
        f = np.fft.fft2(img_flucc)
        ics = np.fft.ifft2(f*np.conj(f)).real / (np.mean(im)**2 * N)
        ics_list.append(ics)
    return np.array(ics_list)


def make_image_stack(
        nx: int = 256,
        ny: int = 256,
        n_gaussians: int = 50,
        shift_vector: np.array = None,
        n_frames: int = 10,
        covariance: list = None
):
    """Computes for reference a set of randomly place Gaussians on a stack of
    images that move from frame to frame as specified by a displacement vector

    :param nx: number of pixels in x
    :param ny: number of pixels in y
    :param n_gaussians: number of gaussians
    :param shift_vector: the vector that shifts the gaussians from frame to frame
    :param n_frames: the number of frames
    :param covariance: the covariance matrix of the gaussians
    :return: numpy array containing a stack of frames
    """
    if shift_vector is None:
        shift_vector = np.array([0.2, 0.2], np.float64)
    if covariance is None:
        covariance = [[1, 0], [0, 1]]
    stack = list()
    gaussians = list()
    for i in range(n_gaussians):
        gaussians.append(
            (np.random.randint(0, nx), np.random.randint(0, ny))
        )
    for i_frame in range(n_frames):
        x, y = np.mgrid[0:nx:1, 0:ny:1]
        pos = np.dstack((x, y))
        img = np.zeros((nx, ny), dtype=np.float64)
        for i in range(n_gaussians):
            x_mean, y_mean = gaussians[i]
            x_pos = x_mean + shift_vector[0] * i_frame
            y_pos = y_mean + shift_vector[1] * i_frame
            rv = scipy.stats.multivariate_normal([x_pos, y_pos], covariance)
            img += rv.pdf(pos)
        stack.append(img)
    return np.array(stack)


# Benchmark
n_test_runs = 3
n_frames = 10
n_gaussians = 20
array_sizes = [32, 64, 128, 256, 512, 1024]
time_numpy_ics = list()
time_tttrlib_ics = list()

for array_size in array_sizes:
    img = make_image_stack(
        nx=array_size,
        ny=array_size,
        n_gaussians=n_gaussians,
        shift_vector=[0.5, 0.5],
        n_frames=n_frames,
        covariance=[[1.0, 0], [0, 8.0]]
    )
    time_numpy_ics.append(
        timeit.timeit(
            'numpy_fft_ics(images=img, subtract_average=True)',
            number=n_test_runs,
            setup='from __main__ import numpy_fft_ics, img'
        )
    )
    time_tttrlib_ics.append(
        timeit.timeit(
            'tttrlib.CLSMImage.compute_ics(images=img, subtract_average="stack")',
            number=n_test_runs,
            setup='from __main__ import tttrlib, img'
        )
    )

labels = list(str(x) for x in array_sizes)
N = len(labels)
width = 0.35
ind = np.arange(N)  # the x locations for the groups
fig, ax = p.subplots()
ax.set_ylabel('time (ms)')
ax.set_title('Time to compute ICS')
ax.set_xticks(ind + width / 2)
ax.set_xticklabels(labels)
rects1 = ax.bar(ind, time_numpy_ics, width, color='y')
rects2 = ax.bar(ind + width, time_tttrlib_ics, width, color='r')
ax.legend(
    (rects1[0], rects2[1]),
    ('numpy_ics', 'tttrlib_ics_fftw3')
)
p.show()
Total running time of the script: (0 minutes 26.421 seconds)