Note
Go to the end to download the full example code
Fitting ICS data by a RICS model

/builds/skf/tttrlib/examples/image_correlation/plot_imaging_ics_fit.py:58: RuntimeWarning: divide by zero encountered in scalar divide
  return offset + 2. ** (-3 / 2) / n * \
/opt/conda/envs/doc-tttrlib/lib/python3.9/site-packages/scipy/optimize/_numdiff.py:590: RuntimeWarning: invalid value encountered in subtract
  df = fun(x) - f0
/builds/skf/tttrlib/examples/image_correlation/plot_imaging_ics_fit.py:219: RuntimeWarning: divide by zero encountered in log
  ax2.imshow(np.log(ics_mean_select), cmap='gray')
/builds/skf/tttrlib/examples/image_correlation/plot_imaging_ics_fit.py:223: RuntimeWarning: divide by zero encountered in log
  ax3.imshow(np.log(model), cmap='gray')
/builds/skf/tttrlib/examples/image_correlation/plot_imaging_ics_fit.py:227: RuntimeWarning: divide by zero encountered in log
  ax4.imshow(np.log(abs(model - ics_mean_select) / ics_std_select), cmap='gray')
import tttrlib
import numpy as np
import scipy.optimize
import pylab as plt
import mpl_toolkits.mplot3d
import matplotlib.patches
import skimage as ski


def rics_simple(
        line_shift: int,
        pixel_shift: int,
        n: float,
        diffusion_coefficient: float = 2.0,
        offset: float = 0.0,
        pixel_duration: float = 11.1,
        line_duration: float = 3.33,
        pixel_size: float = 40.0,
        w_r: float = 0.2,
        w_z: float = 1.0,
        verbose: bool = False
):
    """Simple RICS model.
        -> One 3D diffusion component.
        -> No Triplet/blinking terms.
        -> No Shift between correlations.

    :param line_shift:
    :param pixel_shift:
    :param n:
    :param diffusion_coefficient: in um2/s
    :param offset:
    :param pixel_duration: in micro seconds
    :param line_duration: in milli seconds,
    :param pixel_size: nano meter
    :param w_r: radius of gaussian in xy plane, in um
    :param w_z: radius of gaussian in z, in um
    :param verbose:
    :return:
    """
    if verbose:
        print("diffusion_coefficient", diffusion_coefficient)
        print("n", n)
        print("offset", offset)
    diffusion_coefficient *= 10 ** -12
    pixel_duration *= 10 ** -6
    pixel_size *= 10 ** -9
    line_duration *= 10 ** -3
    w_r *= 10 ** -6
    w_z *= 10 ** -6
    mv = (abs(pixel_shift * pixel_duration + line_shift * line_duration))
    return offset + 2. ** (-3 / 2) / n * \
          (1 + 4 * diffusion_coefficient * mv / w_r**2)**(-1) * \
          (1 + 4 * diffusion_coefficient * mv / w_z**2)**(-0.5) * \
          np.exp(-pixel_size**2*(pixel_shift ** 2 + line_shift ** 2) / (w_r**2 + 4 * diffusion_coefficient * mv))


def rics_diffusion_triplet(
        line_shift: int,
        pixel_shift: int,
        n: float,
        diffusion_coefficient: float = 2.0,
        offset: float = 0.0,
        pixel_duration: float = 11.1,
        line_duration: float = 3.33,
        pixel_size: float = 40.0,
        w_r: float = 0.2,
        w_z: float = 1.0,
        tauT: float = 0.002, # Triplet time in milliseconds
        aT: float = 0.1, # Triplet amplitude
        verbose: bool = False
):
    """Simple RICS model.
    -> One 3D diffusion component.
    -> Triplet/blinking terms.
    -> No Shift between correlations.

    :param line_shift:
    :param pixel_shift:
    :param n:
    :param diffusion_coefficient: in um2/s
    :param offset:
    :param pixel_duration: in micro seconds
    :param line_duration: in milli seconds,
    :param pixel_size: nano meter
    :param w_r: radius of gaussian in xy plane, in um
    :param w_z: radius of gaussian in z, in um
    :param tauT: Triplet time in milliseconds
    :param aT: Amplitude of triplet component
    :param verbose:
    :return:
    """
    pixel_duration *= 10e-6
    line_duration *= 10e-3
    diffusion_coefficient *= 10e-12
    w_r *= 10e-6
    w_z *= 10e-6
    pixel_size *= 10e-9
    tauT *= 1e-3
    mv = abs(pixel_shift * pixel_duration + line_shift * line_duration)
    return offset + 2 ** (-3 / 2) / (n + tauT) ** 2 * (
            (
                    n * (1 + (aT / (1 - aT) * np.exp(-mv / tauT))) *
                    (1 + 4 * diffusion_coefficient * mv / w_r ** 2) ** (-1) * (1 + 4 * diffusion_coefficient * mv / w_z ** 2) ** (-0.5) *
                    np.exp(-pixel_size ** 2 * (pixel_shift ** 2 + line_shift ** 2) / (w_r ** 2 + 4 * diffusion_coefficient * mv))
            )
    )


def chi2(
        x: np.ndarray,
        line_shift: np.ndarray,
        pixel_shift: np.ndarray,
        function,
        data: np.ndarray,
        weights: np.ndarray,
        kw: dict,
        omit_center: bool = True,
        verbose: bool = False
):
    nx, ny = data.shape
    y_model = function(line_shift, pixel_shift, *x, **kw)
    wres = ((data - y_model) / weights)
    if omit_center:
        wres[nx//2, ny//2] = 0
    chi2_s = np.sum(wres**2.0) / (nx * ny)
    if verbose:
        print("line_shift", line_shift)
        print("pixel_shift", pixel_shift)
        print("y_model", y_model)
        print(chi2_s)
    return chi2_s


img = ski.io.imread('../../tttr-data/imaging/ics/RICS_EGFPGFP.tif')
x_range = [100, 200]
y_range = [100, 200]

ics_parameter = {
    'x_range': x_range,
    'y_range': y_range,
    'images': img,
    'subtract_average': "stack"
}

ics = tttrlib.CLSMImage.compute_ics(**ics_parameter)

n_frames, n_lines, n_pixel = ics.shape

# compute mean and std err of mean
ics_mean = ics.mean(axis=0)
ics_std = ics.std(axis=0) / np.sqrt(n_frames)

# shift array
ics_mean_shift = np.fft.fftshift(ics_mean)
ics_std_shift = np.fft.fftshift(ics_std)

# select center
line_center, pixel_center = np.ceil(n_lines//2), np.ceil(n_pixel//2)
line_px = 16
pixel_px = 16
fit_line_start, fit_line_stop = int(line_center - line_px), int(line_center + line_px)
fit_pixel_start, fit_pixel_stop = int(pixel_center - pixel_px), int(pixel_center + pixel_px)
ics_mean_select = ics_mean_shift[fit_line_start:fit_line_stop, fit_pixel_start:fit_pixel_stop]
ics_std_select = ics_std[fit_line_start:fit_line_stop, fit_pixel_start:fit_pixel_stop]

# make indices to compute model
line_shift, pixel_shift = np.indices(ics_mean_select.shape)
line_shift -= ics_mean_select.shape[0] // 2
pixel_shift -= ics_mean_select.shape[1] // 2

# initial values
x0 = np.array([1, 1.0, 0])
bounds = [(0, np.inf), (0, 1000), (0, np.inf)]
kw = {
    'pixel_duration': 11.1111,  # units micro seconds
    'line_duration': 3.3333,  # units milliseconds
    'pixel_size': 40.0,  # nanometer
    'w_r': 0.2,
    'w_z': 1.0
}
fit = scipy.optimize.minimize(
    fun=chi2,
    x0=x0,
    args=(line_shift, pixel_shift, rics_simple, ics_mean_select, ics_std_select, kw),
    bounds=bounds
)

model = rics_simple(
    line_shift, pixel_shift, *fit.x, **kw
)


ommit_center = True
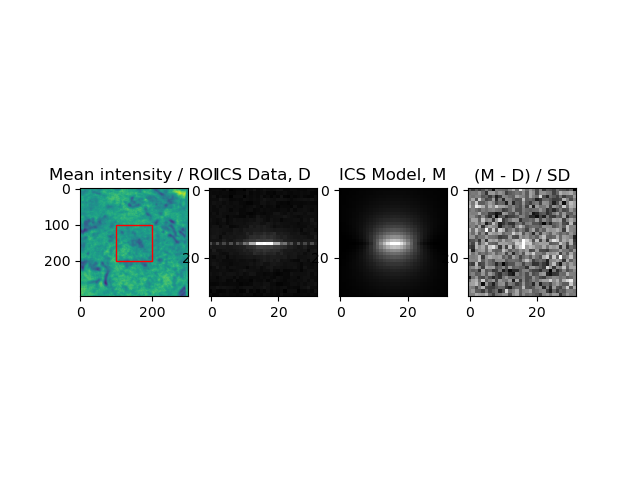
fig = plt.figure()
ax1 = fig.add_subplot(1, 4, 1)
ax1.imshow(img.mean(axis=0))
ax1.title.set_text('Mean intensity / ROI')
rect = matplotlib.patches.Rectangle(
    xy=(x_range[0], y_range[0]),
    width=x_range[1]-x_range[0],
    height=y_range[1]-y_range[0],
    edgecolor='r',
    facecolor="none"
)
ax1.add_patch(rect)
ax2 = fig.add_subplot(1, 4, 2)
if ommit_center:
    nx, ny = ics_mean_select.shape
    data = ics_mean_select
    data[nx//2, ny//2] = 0.0
    model[nx//2, ny//2] = 0.0
ax2.imshow(np.log(ics_mean_select), cmap='gray')
ax2.title.set_text('ICS Data, D')

ax3 = fig.add_subplot(1, 4, 3)
ax3.imshow(np.log(model), cmap='gray')
ax3.title.set_text('ICS Model, M')

ax4 = fig.add_subplot(1, 4, 4)
ax4.imshow(np.log(abs(model - ics_mean_select) / ics_std_select), cmap='gray')
ax4.title.set_text('(M - D) / SD')

# ax2.get_shared_x_axes().join(ax2, ax3)
plt.show()
Total running time of the script: (0 minutes 1.014 seconds)