Note
Go to the end to download the full example code
Computing ICS data by numpy
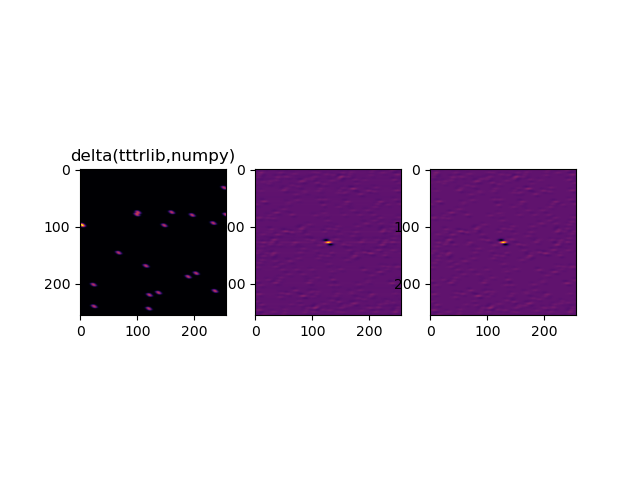
Demonstrate the use of the tttrlib ICS features and compare to numpy ICS implementation when using normal images as input.

import numpy as np
import scipy.stats
import pylab as p
import tttrlib


def numpy_fft_ics(
        images: np.ndarray,
        subtract_average
):
    if subtract_average:
        images = images - images.mean(axis=0) + images.mean()
    ics_list = list()
    _, nx, ny = images.shape
    N = nx * ny
    for im in images:
        img_flucc = im - im.mean()
        f = np.fft.fft2(img_flucc)
        ics = np.fft.ifft2(f*np.conj(f)).real / (np.mean(im)**2 * N)
        ics_list.append(ics)
    return np.array(ics_list)


def make_image_stack(
        nx: int = 256,
        ny: int = 256,
        n_gaussians: int = 50,
        shift_vector: np.array = None,
        n_frames: int = 10,
        covariance: list = None
):
    """Computes for reference a set of randomly place Gaussians on a stack of
    images that move from frame to frame as specified by a displacement vector

    :param nx: number of pixels in x
    :param ny: number of pixels in y
    :param n_gaussians: number of gaussians
    :param shift_vector: the vector that shifts the gaussians from frame to frame
    :param n_frames: the number of frames
    :param covariance: the covariance matrix of the gaussians
    :return: numpy array containing a stack of frames
    """
    if shift_vector is None:
        shift_vector = np.array([0.2, 0.2], np.float64)
    if covariance is None:
        covariance = [[1, 0], [0, 1]]
    stack = list()
    gaussians = list()
    for i in range(n_gaussians):
        gaussians.append(
            (np.random.randint(0, nx), np.random.randint(0, ny))
        )
    for i_frame in range(n_frames):
        x, y = np.mgrid[0:nx:1, 0:ny:1]
        pos = np.dstack((x, y))
        img = np.zeros((nx, ny), dtype=np.float64)
        for i in range(n_gaussians):
            x_mean, y_mean = gaussians[i]
            x_pos = x_mean + shift_vector[0] * i_frame
            y_pos = y_mean + shift_vector[1] * i_frame
            rv = scipy.stats.multivariate_normal([x_pos, y_pos], covariance)
            img += rv.pdf(pos)
        stack.append(img)
    return np.array(stack)


img = make_image_stack(
    nx=256,
    ny=256,
    n_gaussians=20,
    shift_vector=[0.5, 0.5],
    n_frames=10,
    covariance=[[1.0, 0], [0, 8.0]]
)
ics_parameter = {
    'images': img,
    'subtract_average': "stack"
}
ics = tttrlib.CLSMImage.compute_ics(**ics_parameter)
ics_numpy = numpy_fft_ics(images=img, subtract_average=True)

fig, ax = p.subplots(ncols=3)
ax[0].set_title('Image')
ax[0].set_title('tttrlib.ics')
ax[0].set_title('tttrlib.numpy_ics')
ax[0].set_title('delta(tttrlib,numpy)')
ax[0].imshow(img.sum(axis=0), cmap='inferno')
ax[1].imshow(np.fft.fftshift(ics[0]), cmap='inferno')
ax[2].imshow(np.fft.fftshift(ics_numpy[0]), cmap='inferno')
p.show()
Total running time of the script: (0 minutes 1.179 seconds)