Note
Go to the end to download the full example code
Computing ICS data by tttrlib
Demonstrate the use of the tttrlib ICS features and compare to numpy ICS implementation use CLSMImage as an input
import tttrlib
import numpy as np
import matplotlib.pylab as plt
import matplotlib.patches
def numpy_fft_ics(
images: np.ndarray,
subtract_average: bool = True
):
if subtract_average:
images = images - images.mean(axis=0) + images.mean()
ics_list = list()
_, nx, ny = images.shape
N = nx * ny
for im in images:
img_flucc = im - im.mean()
f = np.fft.fft2(img_flucc)
ics = np.fft.ifft2(f*np.conj(f)).real / (np.mean(im)**2 * N)
ics_list.append(ics)
return np.array(ics_list)
data = tttrlib.TTTR('../../tttr-data/imaging/leica/sp5/LSM_1.ptu', 'PTU')
reading_parameter = {
"tttr_data": data,
"reading_routine": 'SP5',
"channels": [0],
"fill": True
}
clsm = tttrlib.CLSMImage(**reading_parameter)
# # specifies a selection on the image
#x_range = [80, 152]
#y_range = [80, 182]
# if nothing or the following ranges are specified
# an ICS of the entire image is computed
x_range = [0, -1]
y_range = [0, -1]
# the ICS routines computes the correlation between pairs or
# images. This way the CCF between different images can be computed, e.g.,
# to compute the correlation between different frames.
# If no image pairs are specified the ACF of the images is computed.
frames = np.arange(0, clsm.n_frames)
frame_shift = 0
img = clsm.intensity
ics_parameter = {
'tttr_data': data,
'x_range': x_range,
'y_range': y_range,
'clsm': clsm,
'frames_index_pairs': list(
zip(
frames.tolist(),
np.roll(frames, frame_shift).tolist()
)
),
'subtract_average': "frame"
}
ics = tttrlib.CLSMImage.compute_ics(**ics_parameter)
# ics = numpy_fft_ics(img[x_range[0]:x_range[1], y_range[0]:y_range[1], :])
ics_mean = ics.mean(axis=0)
ics_std = ics.std(axis=0)
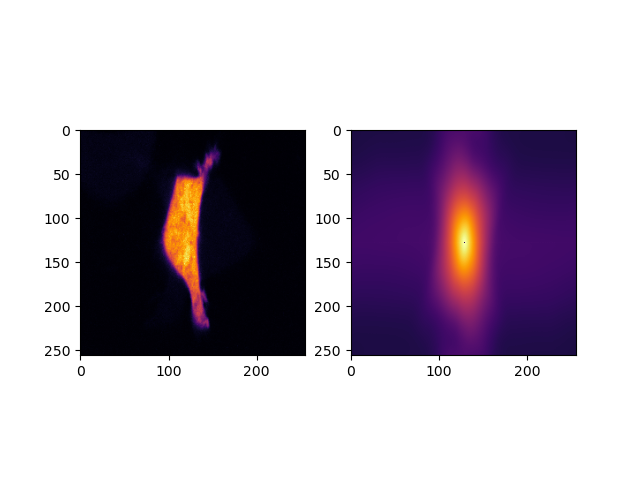
fig, ax = plt.subplots(ncols=2)
ommit_center = True
if ommit_center:
nx, ny = ics_mean.shape
data = ics_mean
data[0, 0] = 0.0
ax[0].imshow(img.sum(axis=0), cmap='inferno')
rect = matplotlib.patches.Rectangle(
xy=(x_range[0], y_range[0]),
width=x_range[1]-x_range[0],
height=y_range[1]-y_range[0],
edgecolor='r',
facecolor="none"
)
ax[0].add_patch(rect)
ax[1].imshow(
np.fft.fftshift(ics_mean),
cmap='inferno',
#vmax=0.00001
)
plt.show()
Total running time of the script: (0 minutes 1.664 seconds)