Note
Go to the end to download the full example code
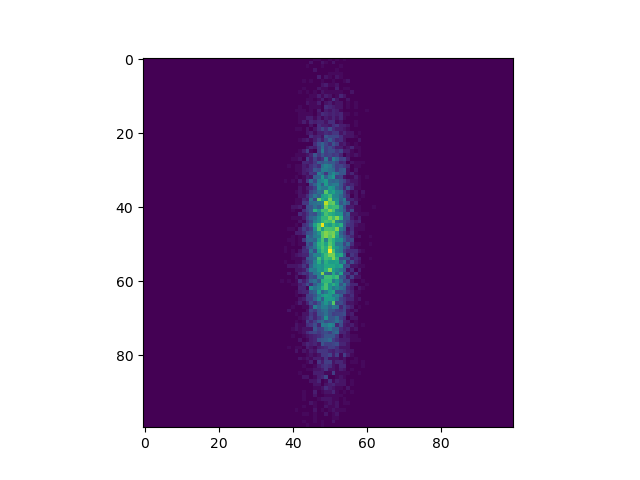
Make a 2D Histogram
import timeit
import tttrlib
import numpy as np
import pylab as p


def histogram2d(data, bins):
    h = tttrlib.doubleHistogram()
    h.set_axis(0, "x", -3, 3, bins, 'lin')
    h.set_axis(1, "y", -3, 3, bins, 'lin')
    h.update(data.T)
    return h.get_histogram().reshape((bins, bins))

x = np.random.randn(10000)
y = 0.2 * np.random.randn(10000)
data = np.vstack([x, y])
bins = 100

hist2d = histogram2d(data, 100)
p.imshow(hist2d)
p.show()
Total running time of the script: (0 minutes 0.100 seconds)