Note
Go to the end to download the full example code
Burst selection routines
The function tttrlib.ranges_by_time_window can be used to define ranges in
a photon stream based on time windows and a minimum number of photons within
the time windows. The function has two main parameters that determine the
selection of the ranges besides the stream of time events provided by the
parameter time:
The minimum window length
minimum_window_lengthThe minimum number of photons in a time window
minimum_number_of_photons_in_time_window
Additional parameters to discriminate bursts are:
The maximum allowed window length
maximum_window_lengthThe maximum number of events in a window
maximum_number_of_photons_in_time_window
The the parameters of the C function and the function header are shown below
void ranges_by_time_window(
        int **output, int *n_output,
        unsigned long long *input, int n_input,
        double minimum_window_length,
        double maximum_window_length=-1,
        int minimum_number_of_photons_in_time_window=-1,
        int maximum_number_of_photons_in_time_window=-1,
        double macro_time_calibration=1.0,
        bool invert=false
)
The units of the macro time are defined by the parameter macro_time_calibration.
For a given TTTR object the functionality is provided by the method
TTTR.get_time_window_ranges. A typical use case of this function is
to select single molecule events confocal single-molecule FRET experiments as
shown below.
import numpy as np
import tttrlib
import pylab as plt

data = tttrlib.TTTR('../../tttr-data/bh/bh_spc132.spc', 'SPC-130')


def save_burst_id(
        fn: str,
        start_stop: np.ndarray
):
    with open(fn, "w") as fp:
        for start, stop in start_stop:
            fp.write("%i\t%i\n" % (start, stop))
This selects ranges in the event stream with a length of at least 250 microseconds with that with at least 20 events. This selection will select “bright” regions in the event stream.
minimum_window_length = 2e-3 # 2 millisecond
maximum_window_length = 30e-3 # 30 millisecond / optional parameter
tw_ranges = data.get_time_window_ranges(
    minimum_window_length=minimum_window_length,
    maximum_window_length=maximum_window_length,
    minimum_number_of_photons_in_time_window=40
)
The method returns an array of indices that mark the start and the stop of the time window in the TTTR events (start1, stop1, start2, stop2, …).
start_stop = tw_ranges.reshape([len(tw_ranges) // 2, 2])
sel = list()
for start, stop in start_stop:
    sel += range(start, stop)
sel = np.array(sel)
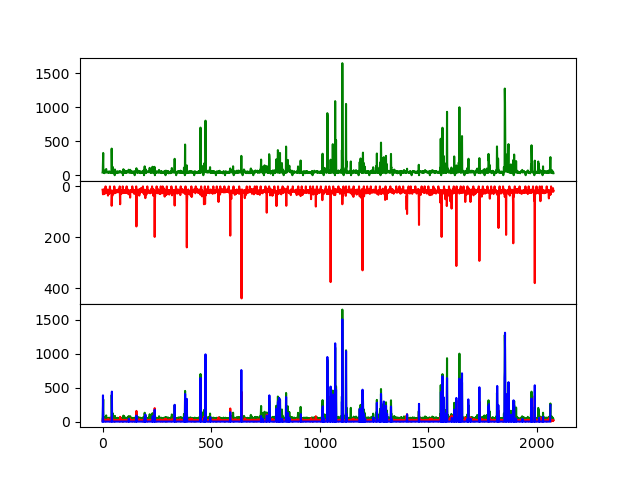
Select the “green” donor and the “red” acceptor events separately for plotting and compute intensity traces The selection is plotted in blue.
green_indeces = data.get_selection_by_channel([0, 8])
red_indeces = data.get_selection_by_channel([1, 9])

intensity_trace_green = data[green_indeces].get_intensity_trace(maximum_window_length)
intensity_trace_red = data[red_indeces].get_intensity_trace(maximum_window_length)
bursts_selected = data[sel].get_intensity_trace(maximum_window_length)
Save the traces to files
# folder = "S:/Papers/00_in_preparation/tttrlib/Figures/Fig1_Introduction/"
# np.savetxt(folder + "red_trace.txt", intensity_trace_red)
# np.savetxt(folder + "green_trace.txt", intensity_trace_green)
# np.savetxt(folder + "bursts_selected.txt", bursts_selected)

fig, ax = plt.subplots(3, sharex=True, sharey=False)
plt.setp(ax[0].get_xticklabels(), visible=False)

ax[0].plot(intensity_trace_green, 'g')
ax[1].plot(intensity_trace_red, 'r')
ax[1].invert_yaxis()

ax[2].plot(intensity_trace_green, 'g')
ax[2].plot(intensity_trace_red, 'r')
ax[2].plot(bursts_selected, 'b')

plt.subplots_adjust(
    left=None, bottom=None, right=None, top=None,
    wspace=None, hspace=0
)

plt.show()
Total running time of the script: (0 minutes 0.232 seconds)