Note
Go to the end to download the full example code
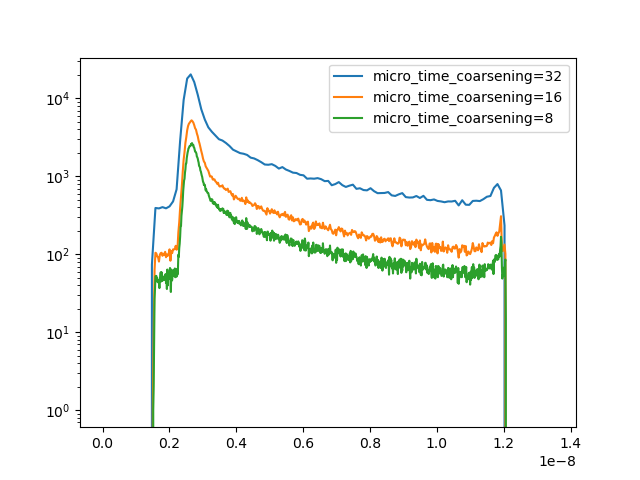
Micro time histograms
import tttrlib
import pylab as p

data = tttrlib.TTTR('../../tttr-data/bh/bh_spc132.spc', 'SPC-130')
h, t = data.get_microtime_histogram(
    micro_time_coarsening=32
)
p.semilogy(t, h, label="micro_time_coarsening=32")

h, t = data.get_microtime_histogram(
    micro_time_coarsening=8
)
p.semilogy(t, h, label="micro_time_coarsening=16")

h, t = data.get_microtime_histogram(
    micro_time_coarsening=4
)
p.semilogy(t, h, label="micro_time_coarsening=8")
p.legend()
p.show()
Total running time of the script: (0 minutes 0.296 seconds)