Note
Go to the end to download the full example code
TTTR reading benchmark
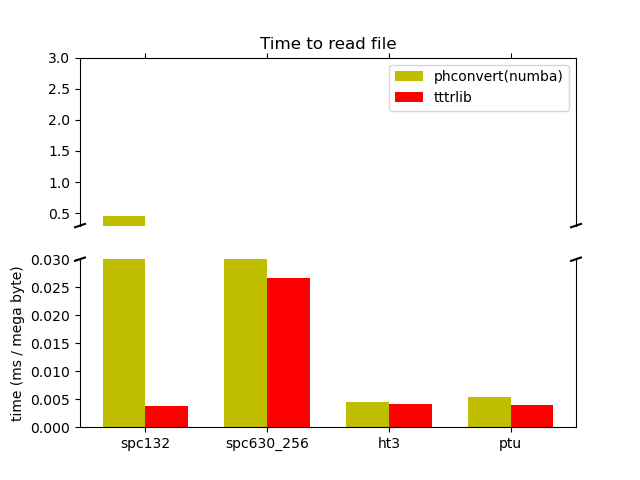
time(phconvert.numba) = 0.5108494288288057 s
time(tttrlib) = 0.0042986441403627396 s
tttrlib speedup: 118.84
time(phconvert.numba) = 0.27472256822511554 s
time(tttrlib) = 0.030576127115637064 s
tttrlib speedup: 8.98
time(phconvert.numba) = 0.3068989892490208 s
time(tttrlib) = 0.27790514938533306 s
tttrlib speedup: 1.10
time(phconvert.numba) = 0.09600712871178985 s
time(tttrlib) = 0.07095773937180638 s
tttrlib speedup: 1.35
#!/usr/bin/python
import os
os.environ['NUMBA_DISABLE_JIT'] = "0"

import timeit
import pathlib

#############
# Test the TTTR reading function
#############

import tttrlib
import phconvert
import phconvert.bhreader
import phconvert.pqreader

import numpy as np
import pylab as p


# Load different file types
# 0 = PQ-PTU
# 1 = PQ-HT3
# 2 = BH-Spc132
# 3 = BH-Spc600_256
# 4 = BH-Spc600_4096 (I don't have a sample file)
# 5 = Photon-HDF5

benchmark_files = [
    {
        "name": "spc132",
        "file": '../../tttr-data/bh/bh_spc132.spc',
        "tttr_mode": 2,
        "phconvert": "bhreader.load_spc",
        "phconvert_args": "spc_model='SPC-134'"
    },
    {
        "name": "spc630_256",
        "file": '../../tttr-data/bh/bh_spc630_256.spc',
        "tttr_mode": 3,
        "phconvert": "bhreader.load_spc",
        "phconvert_args": "spc_model='SPC-630'"
    },
    {
        "name": "ht3",
        "file": '../../tttr-data/imaging/pq/ht3/pq_ht3_clsm.ht3',
        "tttr_mode": 1,
        "phconvert": "pqreader.load_ht3",
        "phconvert_args": "ovcfunc=None"
    },
    {
        "name": "ptu",
        "file": '../../tttr-data/pq/ptu/pq_ptu_hh_t3.ptu',
        "tttr_mode": 0,
        "phconvert": "pqreader.load_ptu",
        "phconvert_args": "ovcfunc=None"
    }
]

times_phconvert_numba = list()
times_phconvert_python = list()
times_tttrlib = list()
for benchmark_file in benchmark_files:
    name = benchmark_file["name"]
    filename = pathlib.Path(benchmark_file["file"])
    size_bytes = filename.stat().st_size
    size_mb = size_bytes / (1024 * 1024)
    filename = str(filename.absolute().as_posix())

    n_test_runs = 1
    ph_str = 'phconvert.{:}("{:}", {:})'.format(
        benchmark_file["phconvert"],
        filename,
        benchmark_file["phconvert_args"]
    )
    time_phconvert_numba = timeit.timeit(
        ph_str,
        number=n_test_runs,
        setup="import phconvert"
    )
    time_tttrlib = timeit.timeit(
        u'tttrlib.TTTR("%s", %s)' % (
            filename,
            benchmark_file["tttr_mode"]
        ),
        number=n_test_runs,
        setup="import tttrlib"
    )
    times_phconvert_numba.append(time_phconvert_numba / size_mb)
    times_tttrlib.append(time_tttrlib / size_mb)
    print("time(phconvert.numba) = %s s" % (time_phconvert_numba / n_test_runs))
    print("time(tttrlib) = %s s" % (time_tttrlib / n_test_runs))
    print("tttrlib speedup: %.2f" % (time_phconvert_numba / time_tttrlib))

# time(phconvert) = 5054 ms (without numba)
# time(phconvert) = 1840 ms (with numba) # 270 MB file -> 141 MB/sec
# time(tttrlib)   = 690 ms               # 270 Mb file -> 391 MB/sec


labels = [b['name'] for b in benchmark_files]

n_file_tests = len(benchmark_files)
width = 0.35
ind = np.arange(n_file_tests)  # the x locations for the groups

fig, (ax, ax2) = p.subplots(nrows=2, ncols=1, sharex=True)

ax2.set_ylabel('time (ms / mega byte)')
ax.set_title('Time to read file')
ax.set_xticks(ind + width / 2)
ax.set_xticklabels(labels)

rects2 = ax2.bar(ind, times_phconvert_numba, width, color='y')
rects3 = ax2.bar(ind + width, times_tttrlib, width, color='r')
ax.bar(ind, times_phconvert_numba, width, color='y')
ax.bar(ind + width, times_tttrlib, width, color='r')

# zoom-in / limit the view to different portions of the data
ax2.set_ylim(.0, 0.03)  # outliers only
ax.set_ylim(0.3, 3)  # most of the data

ax.legend(
    (rects2[0], rects3[1]),
    ('phconvert(numba)', 'tttrlib')
)
#ax.set_yscale('log')

# hide the spines between ax and ax2
ax.spines['bottom'].set_visible(False)
ax2.spines['top'].set_visible(False)
ax.xaxis.tick_top()
ax.tick_params(labeltop=False)  # don't put tick labels at the top
ax2.xaxis.tick_bottom()

d = 0.01
kwargs = dict(transform=ax.transAxes, color='k', clip_on=False)
ax.plot((-d, +d), (-d, +d), **kwargs)        # top-left diagonal
ax.plot((1 - d, 1 + d), (-d, +d), **kwargs)  # top-right diagonal

kwargs.update(transform=ax2.transAxes)  # switch to the bottom axes
ax2.plot((-d, +d), (1 - d, 1 + d), **kwargs)  # bottom-left diagonal
ax2.plot((1 - d, 1 + d), (1 - d, 1 + d), **kwargs)  # bottom-right diagonal

p.show()
Total running time of the script: (0 minutes 2.056 seconds)